Phase correlation
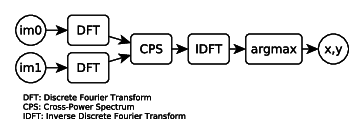
The phase correlation method was introduced by Kuglin et al. [2] and is used to find the translation between two images. It is based on the Fourier shift theorem, which is expressed as follows:
\[ f_2(x,y) = f_1(x - t_x, y - t_y) \] \[ F_2(\xi, \eta) = e^{-j2\pi(\xi t_x + \eta t_y)}F_1(\xi, \eta) \]
If you have two signals (\(f_1, f_2\)) which are related by a translation (\(t_x, t_y\)), then their Fourier transforms (\(F_1, F_2\)) have identical magnitudes but have a phase shift of \(e^{-j2\pi(\xi t_x + \eta t_y)}\).
This phase difference can be calculated by using the normalized cross power spectrum (CPS):
\[ e^{-j2\pi(\xi t_x + \eta t_y)} = \frac{F_1(\xi, \eta)F_2^*(\xi, \eta)}{|F_1(\xi, \eta)F_2(\xi, \eta)|} \]
where \(F_2^*\) is the complex conjugate of \(F_2\). The term \(e^{-j2\pi(\xi t_x + \eta t_y)}\) is the Fourier transform of the shifted dirac delta function (see here). Hence, we can calculate \(t_x, t_y\) by computing the inverse Fourier transform of the CPS and finding the location of the peak/impulse.
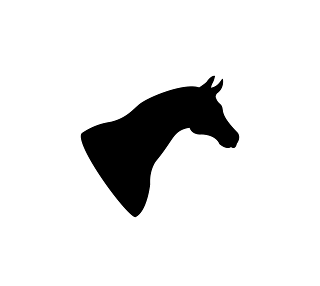
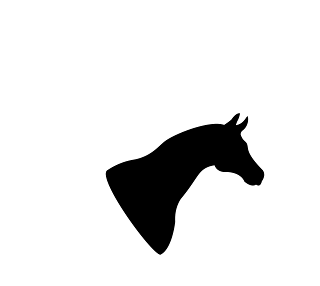
An example is shown below with the two horse outlines. The right image is translated by 25 pixels in \(x\) and 37 pixels in \(y\).
We take the Fourier transform of both images. The magnitude plots of the two images are identical:
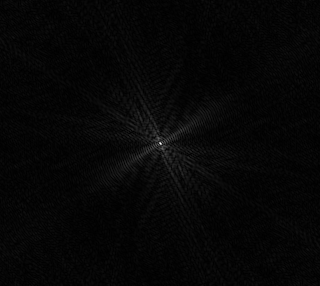
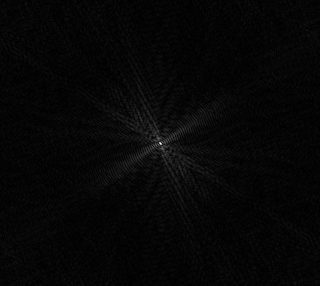
After calculating the CPS and taking the inverse Fourier transform, we get the following output:
![]()
The peak is at (-25, -37), which is required translation to align the second image with the first image.
In real images, the amount of translation is not necessarily an integer. Hence, the peak, which is at a discrete pixel location, would not be an accurate measure of the translation. This is discussed later in additional information.
[2] Kuglin, C. D. and Hines, D. C., 1975. The Phase Correlation Image Alignment Method. Proceeding of IEEE International Conference on Cybernetics and Society, pp. 163-165, New York, NY, USA.