Discrete Fourier Transform
A grayscale image is a real-valued, discrete 2D signal and hence we can compute the discrete Fourier transform (DFT) of it. The result of the transform is a complex-valued signal consisting of a real and imaginary part. This can also be converted into magnitudes and phases.
Here we use the FFTW library which uses the fast Fourier transform (FFT) algorithm to compute the DFT of a given image.
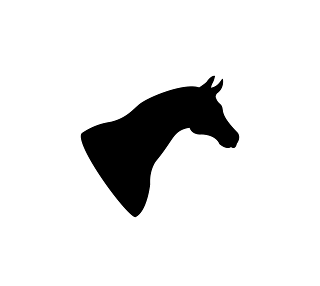
The magnitude plot for the horse outline (source) is as follows:
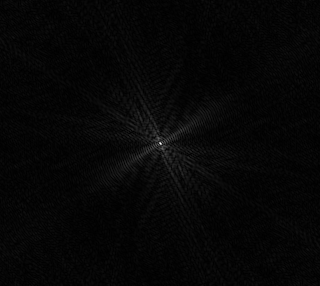
The centre of the magnitude plot represents the magnitude of the zero-frequency component and the remaining pixels represent the magnitudes of higher frequencies (both positive and negative).
Since an image is real-valued, the magnitude plot is conjugate symmetric; i.e. negative frequencies are conjugates of the positive frequencies. You can see this symmetry in the plot; for example, if you vertically flip the right half of the plot, the left and right halves are mirror images of each other (and similarly if you horizontally flip the top half of the image).
The phase part of the Fourier transform indicates the phase shift at that frequency.