Log-polar transform
The log-polar transform is performed by remapping points from the 2D Cartesian coordinate system \((x, y)\) to the 2D log-polar coordinate system \((\rho, \theta)\) \[ \rho = log(\sqrt{(x - x_c)^2 + (y - y_c)^2}) \] \[ \theta = atan2(y - y_c, x - x_c) \] where \(\rho\) is the logarithm of the distance of a given point, \((x,y)\), in the image from the centre, \((x_c,y_c)\), and \(\theta\) is the angle of the line through the point and the centre.
Rotation and scaling in the Cartesian coordinate system are converted into translations in the log-polar coordinate system (along the \(\theta\) and ρ axes respectively). An illustration of the mapping between Cartesian coordinates and log-polar coordinates can be seen in the image below (image inspired by [3])
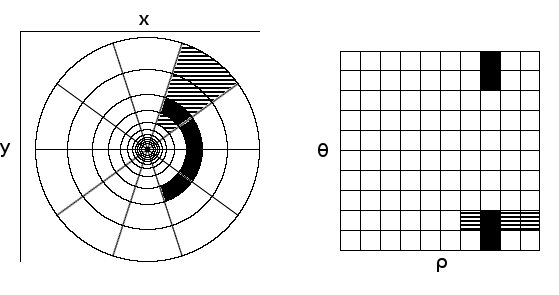
Areas of the image on the left are remapped to areas of the image on the right. The left image uses Cartesian coordinates and the right uses log-polar coordinates. The black regions have the same scale, but are at different angles w.r.t the centre of the image in Cartesian coordinates. When they’re remapped, they are related by translations along the \(\theta\) axis.
Similarly, the striped regions have different scales but are at the same angle w.r.t. the centre. When they are remapped, they are related by translations along the \(\rho\) axis.
By using this transformation, both rotations and scaling between two images can be represented by translations.
Here is an example with rotated and scaled images. The log-polar transforms of the original image, the rotated image and scaled image are shown below.



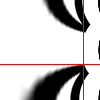
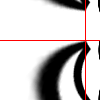
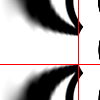
The log-polar image of the rotated image is translated along the vertical axis compared to the log-polar image of the original image. Similarly, the log-polar image of the scaled image is slightly translated along the horizontal axis.
[3] J. N. Sarvaiya, S. Patnaik, and S. Bombaywala, “Image Registration Using Log- Polar Transform and Phase Correlation,” in TENCON 2009-2009 IEEE Region 10 Conference, pp. 1–5, IEEE, 2009